
Sold out but wanted!
Parameters
- 256 pages
- 9 hours of reading
More about the book
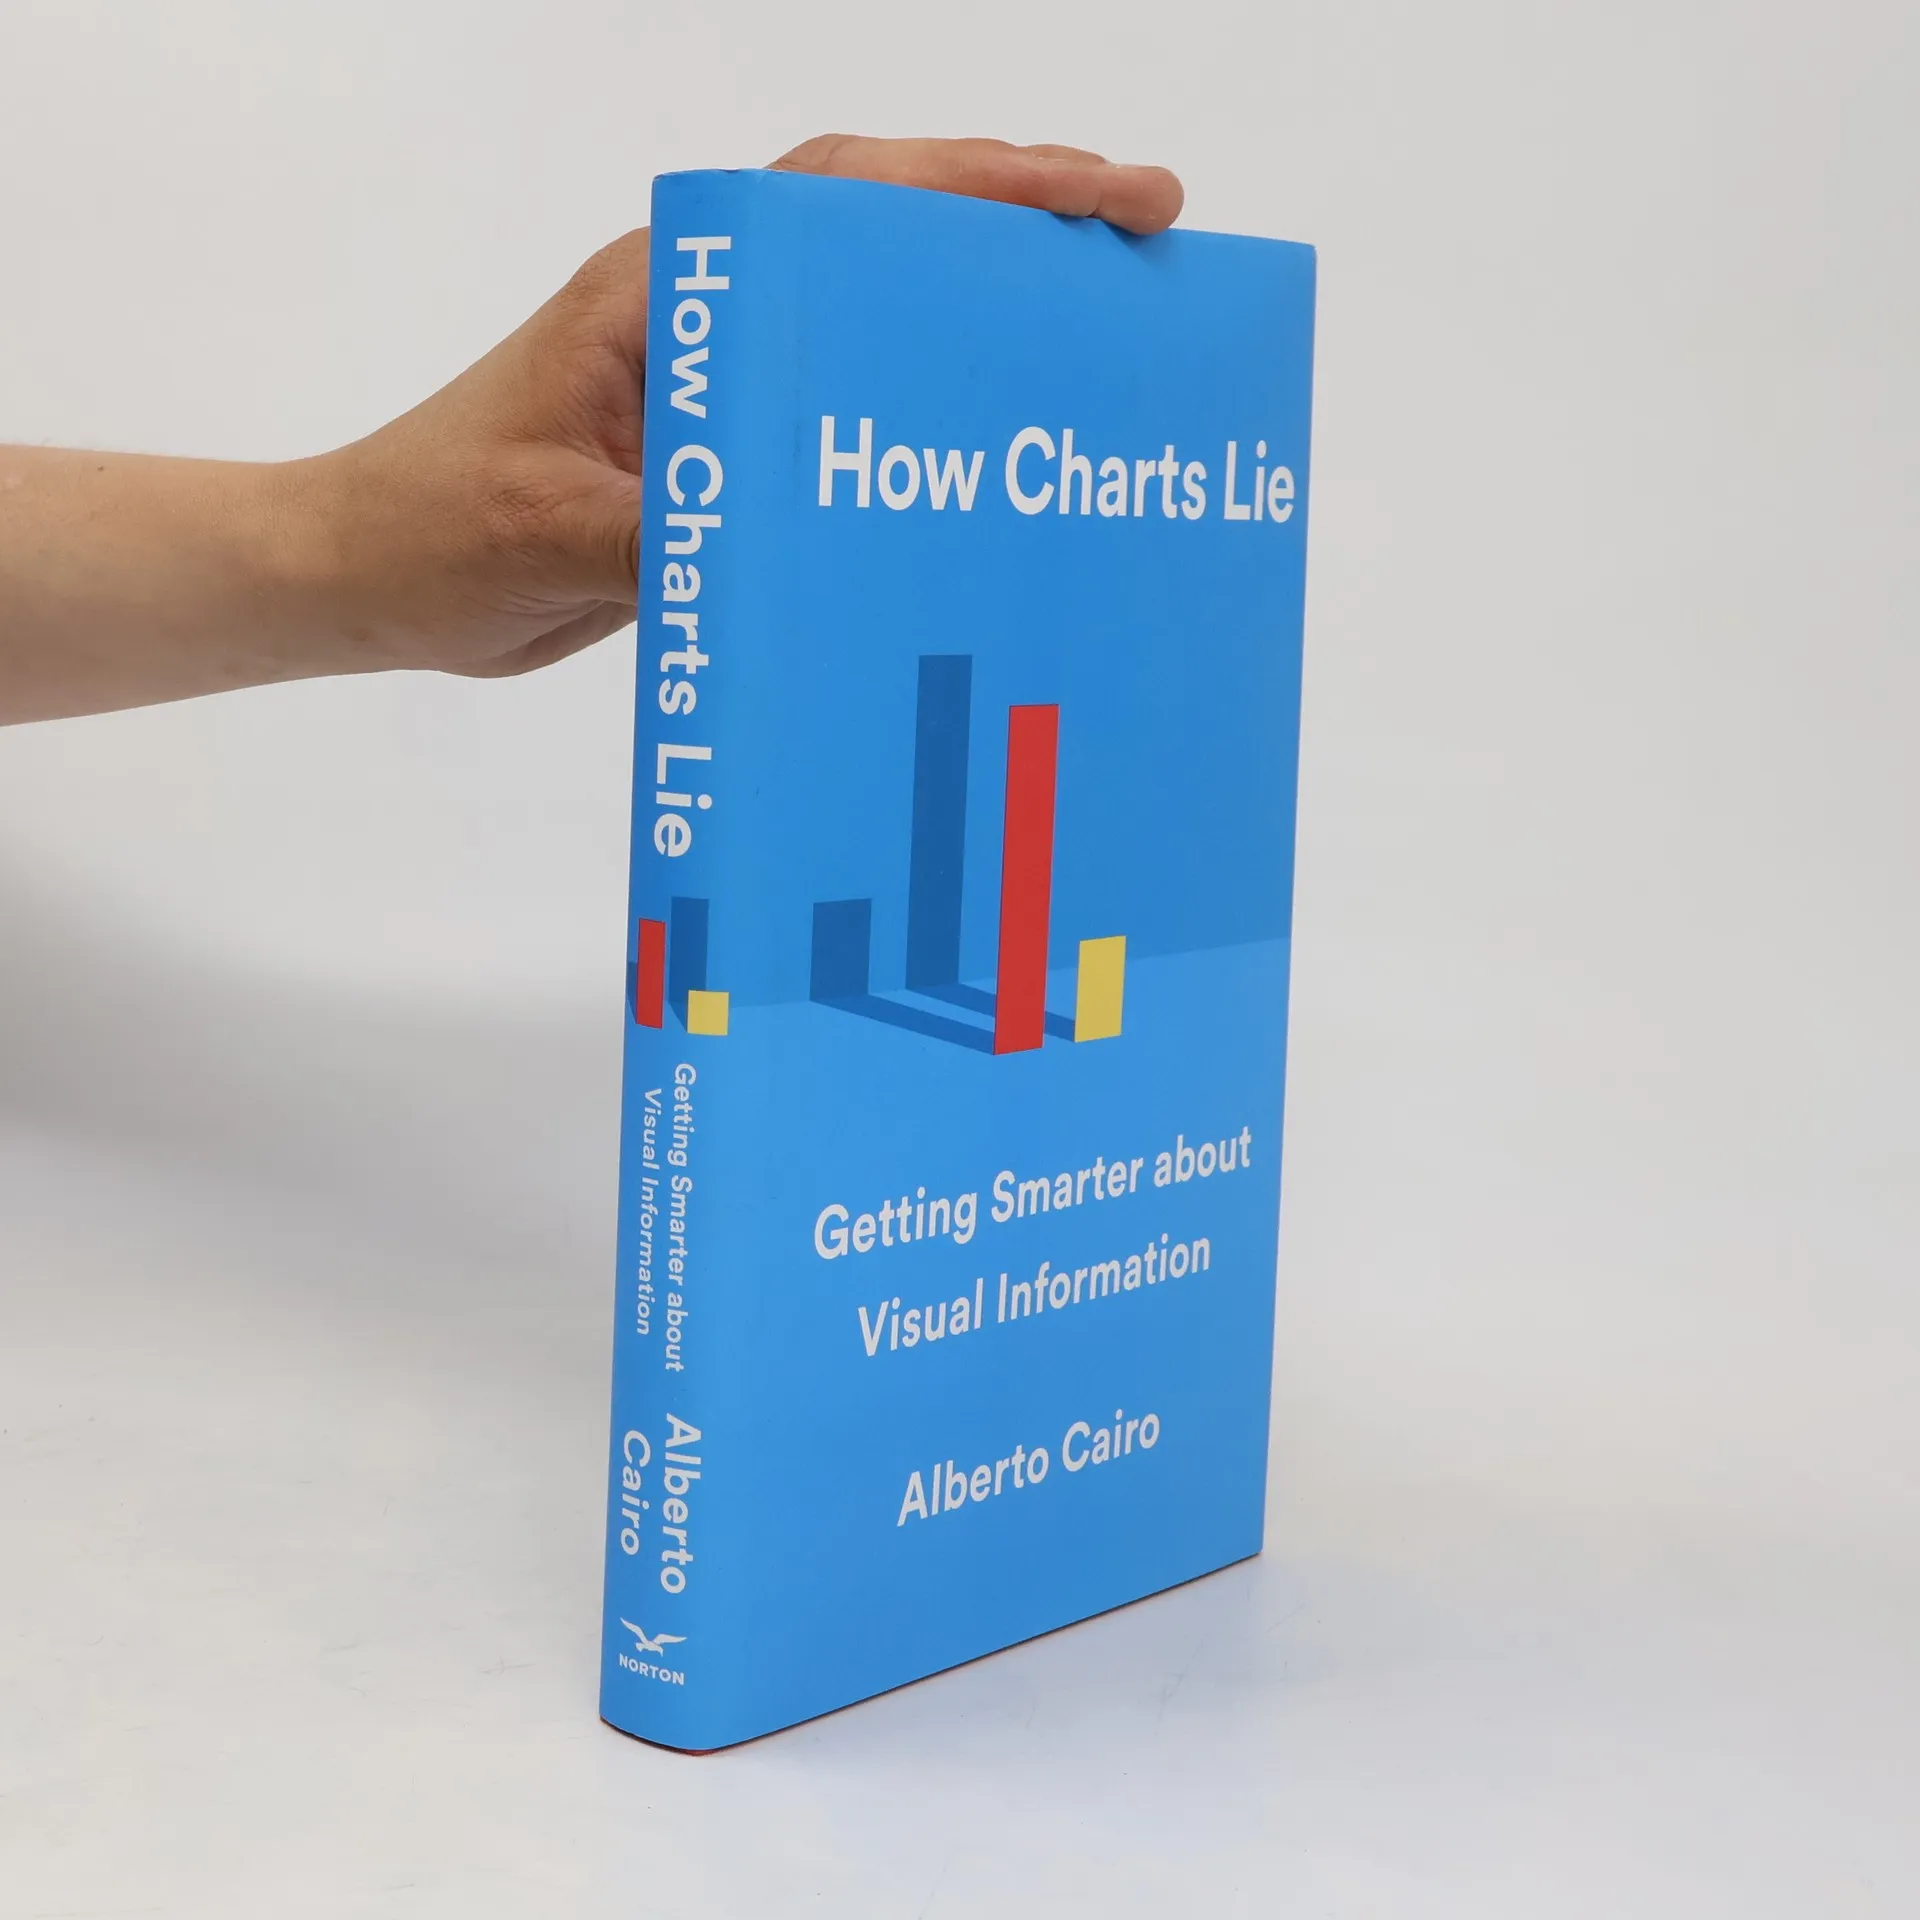
A leading data visualisation expert explores the negative-and positive- influences that charts have on our perception of truth.

Book purchase
How Charts Lie, Alberto Cairo
- Language

- Released
- 2019
- product-detail.submit-box.info.binding
- (Hardcover)
We’ll email you as soon as we track it down.
Payment methods
We’re missing your review here.
- Title
- How Charts Lie
- Language
- English
- Authors
- Alberto Cairo
- Publisher
- WW Norton & Co
- Released
- 2019
- Format
- Hardcover
- Pages
- 256
- ISBN10
- 1324001569
- ISBN13
- 9781324001560
- Series
- Tags
- Non-Fiction, Art & Culture, Business, Business & Management, Science & Math, Psychological Topics, Science, Economics, Mathematics, Design
- Rating
- 4.05 out of 5
- Description
- A leading data visualisation expert explores the negative-and positive- influences that charts have on our perception of truth.